
The S&P 500 lost decade - how to protect your retirement
- Noel Watson CFPᵀᴹ - Chartered Wealth Manager

- Jun 5
- 8 min read
Updated: Jun 23
Introduction
The S&P 500 is an index that tracks the performance of the largest 500 listed companies in the United States. The index has performed very well in recent years compared to other stock markets worldwide, but this hasn't always been the case. In this blog, we look further back in time, focusing on periods when S&P 500 returns haven't been as strong, and evaluate steps you might consider to protect your retirement income.
Recent history - a tech story
In recent years, the largest names in the S&P 500 by market capitalisation have tended to be well-known technology-focused companies. A few years ago, the FAANG stocks (Facebook (before it became META), Amazon, Apple, Netflix and Google) were all the rage. The latest buzzword is the "Magnificent Seven" (Alphabet, Amazon, Apple, Meta, Microsoft, Nvidia and Tesla). A breakdown of the top 10 holdings (Alphabet (Google) appears twice) in a Vanguard S&P 500 index tracker is shown below, with the "magnificent seven" comprising over 30% of the index.

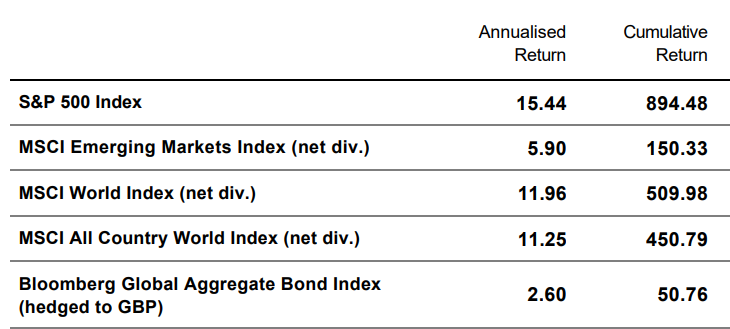
Analysis of comparative returns over sixteen years (commencing at the start of 2010) to the end of 2025 paints an interesting picture, with the S&P 500 generating almost double the returns of global equities (represented by the MSCI All Country World Index) - 895% vs 450%. Emerging markets and global bonds trailed by a long way!

The S&P 500 lost decade: 2000 to 2010
Many might wonder whether there is any point in investing outside the S&P 500, given its results over the last fifteen years. Looking back at recent history, the period from 2000 to 2010 may give us the answer. During this decade, S&P 500 investors had to contend with two significant market downturns: the aftermath of the .com bubble and the Global Financial Crisis (GFC). This turbulence led to a negative return for the S&P 500 over the decade (January 1, 2000 - December 31, 2009).


If you look back at news articles published towards the end of the lost decade, you can see how the mood was very different to today.
"All of the growth in the world is expected to be in emerging markets, and nobody doubts their stability anymore (warning!). So why bother with US equities?"
"Baby boomers are terrified for their retirements. The last thing they want is to lose their cash in another market crash. So they're going to fixed-income"
Now that stocks have recovered some losses, advisers say many clients are seizing the opportunity to cash out of equities and invest more cautiously in the future.
Clients come to financial planners like Frank Boucher, based in Reston, Va., saying they want no exposure to the stock market at all. Boucher warns them that, without the chance for equity gains, they might need to work longer, save more, or spend less. "They say, 'That's fine. At least I get to sleep at night,'
People have had a tough time getting behind equities. It has been a rough year," he said, referring to the year-to-date net outflow of $4.8 billion from U.S. equity funds. Non-domestic U.S. equity funds, however, managed to pull in $152 million, illustrating the negative focus on U.S. equities. Taxable bond funds pulled in a net $4.8 billion, while the safe-haven play -- money market funds -- pulled in a net $6.2 billion.
Since the beginning of 2008, stock mutual funds have suffered cash outflows totalling roughly $245 billion.
Was this S&P 500 "lost decade" a one-off?
Was this lost decade a "one-off"? Fortunately, we have returns data for the S&P 500 going back to 1926 to investigate. The one caveat is that we don't have historical exchange rate data that far back, so we will use USD returns for this analysis. For the 2000-2010 period, the inability to convert to sterling didn't make much of a difference (but it might have done for the other periods we will analyse below).

Looking at the returns for the S&P 500 from 1926 (on a logarithmic scale), we can identify the 2000-2010 lost decade (along with the two market downturns during that period) mentioned above.

The aftermath of the Great Depression is also evident, resulting in another lost decade from 1929 to 1939.

If we cherry-pick our starting date, we can see that the S&P 500 was still below its September 1929 level 15 years later!

The period from 1964 to 1974 was also not far from being a lost decade, with the 1973-1974 stock market crash occurring during that period.

Again, the press proclaimed the death of equities a few years later!

2000-2010 S&P 500 returns vs other indices
We've seen how the S&P 500 is susceptible to a lost decade - let's now compare how the other indices reviewed earlier fared. Recall that the returns for the sixteen years to the end of 2025 had the S&P 500 leading the pack.
S&P 500
Developed markets (equities)
Global markets (equities)
Emerging markets (equities)
Global bonds
However, examining the returns of the S&P 500 over the lost decade compared with other indices paints a very different picture. The 2000-2010 returns "league table" is almost a mirror image of the 2010-2025 one!
Emerging markets (equities)
Global bonds
Global markets (equities)
Developed markets (equities)
S&P 500


S&P 500 vs a real-world portfolio
We will now use Portfolio Visualizer (which is US-based and therefore reports in dollars) to compare the S&P 500 to a more diversified "real-world" portfolio, specifically a 60/40 "No Brainer" with factor tilts. For the 16 years to the end of 2025, the S&P 500 portfolio (Portfolio 2, in red) has returned more than double that of the diversified portfolio ($80,996 vs $31,903).

However, if we refer back to our lost decade, we can see two things:
The diversified portfolio far outperformed the S&P 500.
The diversified portfolio had broadly similar annual returns over the two periods (6.49% vs 7.52%).

If we look over the whole period (January 2000-December 2025), we can see that the S&P 500 has generated greater returns than our diversified portfolio (7.95% vs 7.12%), albeit with greater volatility (15.16% vs 9.98%) and a greater maximum drawdown (-50.97% vs -34.86%). We discuss this in the context of Sequence of Returns Risk below. It's interesting to note that the S&P 500 didn't pull significantly ahead until the end of 2023.

The above analysis assumes perfect investor behaviour. In reality, we would expect our S&P 500 investor to display a larger behaviour gap than the holder of the diversified portfolio, as many investors may have struggled through the 2000-2010 period had they held just the S&P 500, with some selling up and swearing off equities for life.
As mentioned above, the worst-case maximum drawdown for the diversified portfolio relative to the S&P 500 over the whole period was much smaller, as reflected in the annual returns below. The S&P 500 fell by more than 10% over a calendar year five times (2000, 2001, 2002, 2008 and 2022), whereas the diversified portfolio did so just once, in 2008.

What does this mean for creating a sustainable retirement income in the real world?
Let's start by using Portfolio Visualizer to examine how someone retiring at the start of the lost decade would have fared by taking an inflation-adjusted 5% per year from our two portfolios. Alas, things would have been very challenging for our S&P 500 investor, with the investment pot being exhausted by 2017. In contrast, for the holder of the diversified portfolio, things have been more positive, with the balance after 17 years being above the starting amount (in nominal terms).

This may come as a surprise, as our analysis above showed the diversified and S&P 500 portfolios having broadly similar balances after 20 years (2000-2020). The difference is down to the Sequence of Returns Risk (SORR). SORR shows that the order of returns when a retiree is drawing on their portfolio is important, and the S&P 500 lost decade severely impacted the sustainability of the retirement portfolio.
We will now use Timeline to look further back in time. We will use a starting balance of £1,000,000, inflation-adjusted withdrawals of 5% pa and a retirement horizon of 20 years. Our diversified portfolio will be as follows:
36% developed market equity
12% developed market small-cap value
12% emerging market equity
40% global bonds
The S&P 500 will represent the total US equity market. While not an exact match, the differences are not substantial (see Portfolio 1 vs. Portfolio 2). We will begin our analysis in 1926, when historical data for all asset classes became available.
Starting with the US total market portfolio, there were three periods during which a 5% inflation-adjusted return was not sustainable. Unsurprisingly, they occur around the same time as the three challenging periods mentioned above.
There were 17 months during the Great Depression when 5% withdrawals were not sustainable. Some months dipped below 4%.
There were 66 periods from the mid-1960s to the early 1970s.
There were 11 periods from the early 2000s onwards, as analysed above.
This results in a total of 94 months out of 948 months where a 5% (£50,000) withdrawal wasn't sustainable, which is almost 10%.

In marked contrast, our diversified portfolio struggles to support a 5% starting withdrawal rate for only 10 months in the late 1960s, dropping to a low of 4.8%.

Conclusion
The S&P 500 has experienced some very challenging periods over the last century. We have seen that bad times can be difficult, both emotionally (see the comments from various articles above) and from a retirement sustainability perspective.
While ignoring long-term historical outcomes and investing in "what is working now" can be tempting, it is one of many retirement planning choices that can be detrimental to your retirement plan. We find that short-term performance chasers are generally not a good fit for our retirement planning service. They say that diversification is the one free lunch in finance; this is particularly important when planning a sustainable retirement.
There is always the chance that "this time is different". It is always possible, and the S&P 500 may continue to outperform other indices, avoiding another lost decade. However, it may not. Research from Cambria Investment Management suggests that a decade of strong U.S. stock market growth has historically been followed by a decade of subdued returns.
The Roaring Twenties were followed by the Great Depression.
The Nifty Fifties were followed by the inflationary 70s.
The Internet Bubble was followed by the .com bust and the GFC.

About Pyrford Financial Planning
Pyrford Financial Planning is an Independent Financial Adviser based in Weybridge, Surrey.
We specialise in retirement planning and provide independent financial advice, including pension and investment advice, and inheritance tax planning.
We offer a no-obligation introductory meeting, which will be held over Zoom.
Our office telephone number is 01932 645150.
Our address is No. 5 The Heights, Weybridge, Surrey, KT13 0NY.
Please note: This blog is for general information only and does not constitute advice. The information is aimed at retail clients only.
Although best efforts are made to ensure all information is accurate, you should not rely on this blog for your personal situation or planning.
The value of your investment can go down as well as up, and you may not get back the full amount you invested. Past performance is not a reliable indicator of future performance.
About the author

Noel is passionate about helping clients plan for retirement, preparing and guiding them through this key life transition. He has written a book on retirement planning and regularly publishes retirement research on this blog.


Comments