
The most efficient way to blow up your retirement plan

Updated: Jul 7
Introduction
Last week, we examined the impact of living too long on the sustainability of retirement income and found that it was not as great as might be expected for our example clients. Today, we examine additional variables that influence retirement outcomes.
Ian and Janet
We will again be using Ian and Janet, and a summary of their situation is below:
Ian, 62, and Janet, 58, are both in good health and considering retiring next year. Together, they have a retirement portfolio of £1,000,000.
We will make the following assumptions:
Neither Ian nor Janet will receive a state pension.
Taxation and taxation optimisations are ignored.
They do not plan to gift to their children or leave a legacy.
They are not expecting any inheritances.
They do not want to plan for potential care home fees.
They are not planning to downsize.
Expenditure will increase in line with inflation each year.
They are not planning to purchase a secure income (e.g., an annuity) at any stage.
Fees are 1.1% per annum, which covers advice, fund and platform fees, and is typically what a client with this amount invested would pay with Pyrford Financial Planning.
Their portfolio consists of 70% equities and 30% bonds, broken down as follows:
42% developed market equities (large and mid-cap).
14% developed small-cap value equities
14% emerging markets
30% bonds
We will assume spending starts at £51,500 per annum, and for all scenarios, we will evaluate:
The historical success rate.
The safe withdrawal rate (SWR).
How long the money lasts in the worst case.
Baseline case: 30-year retirement
As can be seen from the below:
The historical success rate is 84%.
The SWR is 3.86%.
The worst-case historical scenario has the investment pot running out when Janet is 74.


Not diversifying
We have looked at the downsides of not diversifying a retirement portfolio many times previously:
We will replace the current portfolio, which consists of:
42% developed market equities (large and mid-cap).
14% developed small-cap value equities
14% emerging markets
30% bonds
with a portfolio solely consisting of US total market equities.
The historical success rate has fallen 7% to 77%.
The SWR has fallen 1% from 3.86% to 2.86%.
In the worst historical case, the money runs out four years earlier at Janet's age of 70.


Not taking enough equity exposure
Our analysis of the 4% rule examined the impact of reducing portfolio equity content on success rates, and below we evaluate how it fares compared with the other scenarios.
Our baseline portfolio consists of 70% equities and 30% bonds, broken down as follows:
42% developed market equities (large and mid-cap).
14% developed small-cap value equities
14% emerging markets
30% bonds
We will now adjust the top-level asset allocation to 30% equities and 70% bonds with underlying holdings as follows:
18% developed market equities (large and mid-cap).
6% developed small-cap value equities
6% emerging markets
70% bonds
The historical success rate has fallen 36% to 48%!
The SWR has fallen 0.95% from 3.86% to 2.91%.
The worst case has the money out around 3.5 years earlier at Janet's 70.5.


For reference, a client with 50% equities and 50% bonds, broken down as follows
30% developed market equities (large and mid-cap).
10% developed small-cap value equities
10% emerging markets
50% bonds
has the following outcomes:
71% success rate.
SWR of 3.5%.
The money is exhausted when Janet is 74, the same as the baseline case.


60% developed market equities (large and mid-cap).
20% developed small-cap value equities
20% emerging markets
we see the following:
91% success rate.
SWR of 3.78%.
The money is being exhausted at Janet's 72.5 in the worst case.


Investor misbehaviour
Investor misbehaviour creates a gap between the returns a portfolio generates and the returns the investor actually receives. Examples of misbehaviour include performance chasing and "buying high and selling low." This gap is known as the behaviour gap.
There is extensive research on how much investors underperform their chosen investments. Challenge fourteen in our 4% "rule" blog identified this behaviour gap as ranging from less than 1% to over 5% per annum.
Boring Money's analysis of the bestselling funds/ETFs on the Hargreaves Lansdown platform in March 2024 shows where investor money has been directed. One could argue this is investor misbehaviour in real time!
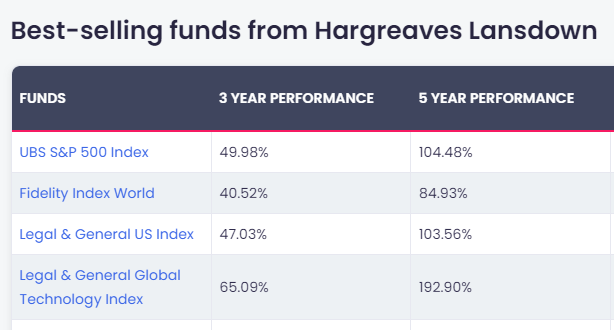

We can arguably see something similar from investors across the pond. According to research from State Street Global Advisors.
"Long-term investors’ aggregate allocation to fixed income, relative to equities, has not been this unbalanced since before the global financial crisis (GFC)".

As the article points out, with U.S. equities outperforming bonds in recent years, this imbalance may be partly due to investors not rebalancing their portfolios, rather than solely to performance chasing.
Given the range of behaviour gaps, we will assume a 3% gap for our example. Add platform and investment fees (no adviser fees, as this is a D.I.Y. investor), and the total fees are 3.5%. We will use the same portfolio as the baseline case to focus on investor misbehaviour. Realistically, investor misbehaviour is more likely to go hand in hand with undiversified portfolios, and we explore this in our double bubble example below.
The historical success rate plummeted to 49%.
The SWR has fallen over 1% to 2.84%
The worst case has the money running out three years earlier at Janet's 71.


Paying high fees
Our baseline case uses total fees of 1.1% per annum. Our research on ongoing financial advice fees (financial advice, platform, and investment fees) suggests an average of between 1.75% and 2.18% per annum. However, these are averages; we have seen cases where ongoing fees approach 3% per annum. For this example, we will assume fees of 2.5%.


Double bubble - not diversifying and investor misbehaviour.
As mentioned above, these two should probably be grouped together, with misbehaving investors tending to performance chase (buying high and selling low) and investing in what is working now (which, by definition, is not a diversified portfolio).
In our analysis of how much needed to be saved for a moderate retirement, we used John Dalton as an example of misbehaviour. John had invested his retirement funds in U.S. tech based on their recent strong performance, and his misbehaviour was costing him 3% per annum, the same as our example above, and one we will also use for this example (total fees of 3.5%)
The historical success rate has fallen 22% to 62%
The SWR has fallen 1.79% from 3.86% to 2.07%!
The worst case has the money out 6 years earlier at Janet's 68.


There are many "John Daltons" in the world, and we find them to be typically outspoken in their disdain for the value a financial adviser can provide. As we point out in point 7 of "Ten reasons why we might not be the right financial adviser for you," it's fair to say our investment approach wouldn't be a good fit for a performance chaser!
Conclusion
There are several ways to compare the above scenarios in terms of their efficiency in blowing up a retirement plan. Focusing solely on the historical success rate, we can see that a portfolio consisting of 30% equities yielded the worst outcome, closely followed by investor misbehaviour. If we compare safe withdrawal rates, we can see that the "double bubble" has by far the worst outcome, and this is also the case for the worst-case longevity.

Our view is that, of the three measures, the safe withdrawal rate and worst-case longevity are the ones we would focus on, as they indicate how much adjustment might be needed if investment returns and/or inflation are not favourable, particularly in early retirement.
In a perfect world, retirees' outcomes would closely align with the baseline case. In reality, many individuals pay high financial adviser fees or have portfolios with an equity content too low to provide a reasonable chance of a successful outcome. However, we believe both options will likely yield better outcomes than our "double bubble" example. Judging by the HL best-buy tables, many investors seem to be at risk of falling into the "double bubble" trap. As shown in the two screenshots below, the range of outcomes for the "double bubble" scenario is far greater than that of the baseline case. The best cases for both scenarios have a final balance just north of £6m (in real terms), but, as identified above, the "double bubble" worst case is far worse and would therefore get our vote for the most efficient way to blow up a retirement plan.


About Pyrford Financial Planning
Pyrford Financial Planning is an Independent Financial Adviser based in Weybridge, Surrey.
We specialise in retirement planning and provide independent financial advice, including pension and investment advice, and inheritance tax planning.
We offer a no-obligation introductory meeting, which will be held over Zoom.
Our office telephone number is 01932 645150.
Our address is No. 5 The Heights, Weybridge, Surrey, KT13 0NY.
Please note: This blog is for general information only and does not constitute advice. The information is aimed at retail clients only.
Although best efforts are made to ensure all information is accurate, you should not rely on this blog for your personal situation or planning.
The value of your investment can go down as well as up, and you may not get back the full amount you invested. Past performance is not a reliable indicator of future performance.
About the author

Noel is passionate about helping clients plan for retirement, preparing and guiding them through this key life transition. He has written a book on retirement planning and regularly publishes retirement research on this blog.


Comments