The 4% rule - is it still valid for UK retirees?
- Noel Watson CFPᵀᴹ - Chartered Wealth Manager

- Sep 6, 2025
- 19 min read
Updated: Nov 4, 2025
Table of contents
The nastiest, hardest problem in finance
Nobel Prize-winning professor William Sharpe once called it the "nastiest, hardest problem in finance". He was talking about retirement planning, with the three future unknowns:
longevity;
inflation;
investment returns
making for a complex answer to what, on the face of it, seems like a simple question:
“Will I/we run out of money before I/we die?”
William Bernstein, a financial theorist and neurologist, had this to say:
"No one in his right mind would walk into the cockpit of an airplane and try to fly it, or into an operating theater and open a belly. And yet they think nothing of managing their retirement assets. I've done all three, and I'm here to tell you that managing money is, in its most critical elements even more demanding than the first two.!"
Pensions Freedoms
The challenge of creating a sustainable retirement income is relatively recent for UK retirees. In the 2014 Budget, Chancellor George Osborne announced radical pension freedoms, which came into force in 2015, allowing retirees to access their Defined Contribution pensions flexibly from the age of 55 without incurring tax penalties. Before pension freedoms, most retirees purchased an annuity, which had become less attractive due to falling annuity rates.
These freedoms haven't always led to positive client outcomes, with more than £30m lost to pension scammers between 2017 and 2020. The problem seems to be getting worse, with an estimated £17.7m lost in 2023 alone. Furthermore, according to FCA data, around 40% of regular withdrawals were taken at an annual rate of over 8% of the pot value, which many consider unsustainable.
The '4% rule'
A popular 'rule of thumb' is that you can safely take an inflation-adjusted 4% from your pensions and investments each year (far lower than the 8% mentioned above) without running out of money in retirement. How might this rule apply to a UK-based retiree? Let's start by looking at the work of the man who undertook the original research!
William "Bill" Bengen
After studying aeronautics and astronautics at MIT, Bill Bengen worked in his family's bottling business before pursuing his CFP certification and launching his financial planning business. In 1994, Bill published a landmark paper in the Journal of Financial Planning named 'Determining withdrawal rates using historical data'.
Bengen analysed historical market returns from 1926 and determined the highest withdrawal rate as a percentage of the initial investment pot that a retiree could withdraw each year, adjusted for inflation in subsequent years, without running out of money over a thirty-year retirement. He named this the Safe Withdrawal Rate (SWR) and found that the SWR was around 4% for his dataset.
An example is shown below:
Starting pot: £1,000,000
Withdrawal in year one: £40,000
Inflation at the start of year two: 2%
Withdrawal in year two: £40,800 (£40,000 * 1.02)
Inflation at the start of year three: 3%
Withdrawal in year three: £42,024 (£40,800*1.03)
Repeat the process every year until the 30-year mark is reached.
Challenges overview
It's worth noting that Bengen never claimed the 4% SWR was a rule; he believed the media had invented it, according to an interview with Michael Kitces conducted in 2020. We will explore reasons why this 'rule' should not be taken as gospel, breaking our analysis down into three parts:
Data challenges of the 4% rule
Real-world challenges of the 4% rule.
Investor challenges of the 4% rule.
We will use the example clients, David and Samantha Smith. David Smith is 60 and has recently retired from ABC Chemicals. His wife, Samantha, is 55 and also retired. Together, they have a retirement portfolio of £1,000,000 and are looking for a sustainable income of £40,000 per annum.
To simplify the analysis and help illustrate the key points, we will make the following initial assumptions:
Neither David nor Samantha will receive a state pension.
Taxation and taxation optimisations are ignored.
They do not plan to gift to their children or leave a legacy.
They are not expecting any inheritances.
They do not want to plan for potential care home fees.
They are not planning to downsize.
They are keeping expenditure assumptions simple. For example, they have chosen not to differentiate between early and late retirement spending.
They do not plan to purchase a secure income (e.g., an annuity) at any stage.
They have a 30-year retirement horizon (i.e. David dies at 90 and Samantha at 85).
They are paying no fees.
David and Samantha will be following the strategy outlined above, with a starting withdrawal of £40,000 (4%) in the first year. We will be using a tool called Timeline, which is used by many financial planners specialising in retirement planning. Timeline uses historical market returns across broad asset classes and inflation data to provide a range of outcomes. For example, had (older versions of) David and Samantha retired in September 1962, Timeline shows whether they would have run out of money before September 1992, given their planned portfolio, withdrawals and retirement horizon (30 years). However, the outcome would have been slightly different if they had retired a month later (due to differing inflation and market returns in the two non-overlapping months - September 1962 and October 1992). By analysing hundreds of such historical outcomes (12 per year multiplied by the number of available years), we can obtain valuable insights into the future potential outcomes which David and Samantha might reasonably expect. We have used Timeline since 2018, and readers of Noel’s book, 'Planning for Retirement: Your Guide to Financial Freedom', will recognise the concepts and diagrams (and David and Samantha!).
Data Challenges
Challenge One: The 4% “rule” doesn’t necessarily hold for UK retirees.
Bengen used US historical data for his original work, examining outcomes for a range of portfolios comprising 0% to 100% large-cap stocks in 25% increments, with the remainder in intermediate-term bonds. He found the sweet spot to be between 50% and 75% stocks.
“Sorting this all out, I think it is appropriate to advise the client to accept a stock allocation as close to 75 percent as possible, and in no cases less than 50 percent. Stock allocations lower than 50 percent are counterproductive, in that they lower the amount of accumulated wealth as well as lowering the minimum portfolio longevity. Somewhere between 50-percent and 75-percent stocks will be a client’s “comfort zone.”
We will start with a portfolio consisting of 50% developed market stocks and 50% global bonds and adjust our annual withdrawals using historical UK inflation rates. This portfolio differs slightly from our "No Brainer" portfolios as it excludes emerging markets stocks, but we believe it is adequate for comparison purposes. As a reminder, we will use a 30-year retirement horizon (i.e. David dies at 90 and Samantha at 85).
As can be seen from the screenshot below, the news appears less favourable compared to Bengen's research, with David and Samantha only able to take out a maximum initial starting withdrawal of £33,500 (3.35%) in the first year (see the red bar in the screenshot below) without risk of running out of money further down the road versus around 4% for the Bengen analysis. However, it's worth noting that this worst case occurred in 1915, before Bengen's 1926 start date. If we were to constrain our analysis to the 1926 start, our worst case in this more limited dataset is our (unfortunate) 1968 retiree, with a safe withdrawal rate of 4.01%.

Put another way, taking out 4% could see the money running out after around 21 years in the historical worst-case example, nine years short of the thirty-year retirement horizon.

It’s worth noting that readers of Noel’s book may observe slight differences in SWR rates and the worst historical times compared to the analysis in this blog. For example, the book reports a worst-case SWR of 3.42% that occurred in the late 1960s, whereas, in this example, we have 3.35% for the 1915 retiree. Timeline has periodically altered and improved its data, which mainly explains the differences.
It’s worth emphasising that retirement planning is not an exact science, a point we will revisit (again and again!), and there is always the potential for differences in historical analysis:
Variations in asset class returns used: The original Bengen study focused solely on the US; our analysis expanded this to include developed markets. Bengen published subsequent research in 1996, adding small-cap stocks to the original two asset classes (large-cap stocks and intermediate-term bonds). He found an increase in the safe withdrawal rate (up to 4.3%), but cautioned that this might not hold in the future.
Different periods analysed. See Challenge 3.
Country-specific inflation. For example, the UK experienced particularly high inflation during the 1970s and the First World War.


Challenge Two: Asset allocation of 50% stocks and 50% bonds
In Challenge One, we used a portfolio of 50% developed market stocks and 50% global bonds. Real-world portfolios may differ from this. For example, if we increase the portfolio's equity content from 50% to 60%, the SWR increases from 3.35% to 3.48%, and the money lasts for an additional few years in the worst-case scenario. Conversely, if we reduce the stock content to 30% (and therefore, our portfolio contains 70% bonds), our SWR is now down to 3.06%, and the worst-case scenario shows the money running out after approximately 17 years.
Note that it's not just the stock-bond split in the portfolio that can impact our SWR, but also diversification (or lack thereof). If we use 100% US market stocks for our portfolio rather than the more diversified developed markets/global bond portfolio, the safe withdrawal rate reduces slightly from 3.35% to 3.26%. This outcome emphasises the importance of diversification (both by asset class and geography) and of not having all your eggs in one basket. The current bestselling ETFs on popular retail investment platforms suggest that many retail investors may not consider this important.

Challenge Three: Limited historical data
Bengen published his paper in 1994, and his analysis covered the period from 1926 to 1992, a span of just 66 years. However, it’s worth noting that Bengen wouldn’t have known how, for example, the 1970 retiree would have fared, as he didn’t have a full 30 years of retirement data when he wrote the paper in 1994.

Over thirty years have passed since Bengen’s original work, and, as discussed, Timeline has data going back to 1915 (which coincided with the worst historical year to retire in the dataset), meaning that we now have nearly 80 years of retirement data available (Timeline currently goes to the end of 2023, so our "latest" retiree for a 30-year retirement would be someone finishing work in 1993). Although 80 years of retirement data may seem substantial, it represents less than three of our 30-year retirements analysed. We may encounter market conditions in the future that are far worse than those reflected in our historical data. For example, Morningstar research suggests that a sustainable withdrawal rate closer to 3% may be more appropriate due to elevated valuations. (Of course, safe withdrawal rates can only be determined in hindsight, so it's always worth bearing this in mind when reading predictions!).
As historical market data continues to improve in quality (cleaner, with fewer errors) and quantity (extending further in time), it can prompt us to question our beliefs. For example, research by Edward McQuarrie has challenged the assumption that many investors hold, namely that stocks consistently outperform bonds over the long term. McQuarrie's research again emphasises the point we covered in Challenge One that the data we use for our retirement modelling may well be revised in the future.
Challenge Four: Starting stock market valuations are not taken into account
Picture the scene: David and Samantha retired in 2025 and started drawing down their investment pot at the rate of 3.3% (£33,000 per annum), using a portfolio of 50% stocks and 50% bonds. Based on historical data, they are reasonably confident they can continue to take inflation-adjusted withdrawals from their portfolio over the next 30 years without running out of money.
Fast forward two years to 2027. Another couple, let's call them Mark and Rebecca Jones, have identical investments and expenditure plans and are planning their retirement. Their investment pot, which was at the same £1m as the Smiths in 2025, is now valued at £850,000 after the market slump of 2026. They now feel they can only spend around £28,000 (3.3%*£850,000) without running out of money due to the lower starting investment balance
.
This paradox was described by leading US financial planner Michael Kitces in a 2008 publication. Bengen built upon Kitces' research in a 2020 article, suggesting higher initial withdrawal rates (albeit with a smaller starting pot) should be considered due to lower (better) asset valuations (as you might expect after market falls).
Real-world challenges
Challenge Five: Zero fees
Bill Bengen's research did not account for the costs that may be incurred when taking a retirement income. There are many to consider, and our blog, 'How much does a financial adviser cost for retirement planning (and am I getting good value)?' looks at these in more detail, including the following:
Platform fees
Investment fund charges
Discretionary fund manager fees
Financial adviser fees
Recall from challenge one that for a 50% stock portfolio with zero costs, the historical safe withdrawal rate (SWR) was 3.35%, with the money running out after around 21 years (nine years short of a 30-year retirement horizon). If we apply a 1% per annum (pa) total cost, the SWR has fallen to 2.97%. Note that this is less than the 1% reduction in SWR that we might expect. In poor scenarios (i.e., those that tend to produce the worst-case historical SWRs), the costs tend to drop in line with the portfolio value (assuming fees are calculated as a percentage of the invested assets basis). In contrast, inflation-adjusted withdrawals tend to increase over time, meaning that in these unfavourable scenarios, the fees are relatively small compared to the withdrawals and, hence, have a smaller impact than might be expected.

In the worst-case scenario with 1% fees applied, the portfolio is exhausted after approximately 18 years, a reduction of three years compared to the no-fee benchmark.
Total costs for those using a financial adviser are estimated to be between 1.9% and 2.3% per annum. If we increase the total costs from 1% to 2.5% per annum, the SWR reduces to 2.45%. In the worst-case scenario, the portfolio is now exhausted after 15 years.
As an aside, the levels of these fees are unfortunately more common than you might expect or hope, and we'd suggest that if you have a retirement pot of a similar size to David and Samantha, you can access retirement planning at a far lower cost.
Challenge Six: 30-year retirement horizon
Bengen's research examined portfolio sustainability for a minimum 30-year retirement, which we have applied to challenges one to five. Timeline can incorporate the Office of National Statistics (ONS) survival rates, and we can use this option to forecast when either David or Samantha has a survival probability of 10% or less. At their retirement ages of 60 and 55, respectively, this 10% survival probability would occur when Samantha is 100, increasing the retirement horizon from 30 to 45 years.
The impact of the retirement pot having to last for an extra 15 years reduces the SWR from 3.35% (from Challenge One) to 2.90%. You can see that in the worst case, the pot runs out a long way before Samantha's 100th birthday, and this scenario assumes zero fees!

Challenge Seven: Not evaluating whether the money is likely to outlast the retiree
We have so far examined fixed 30 and 45-year retirement horizons. In the real world, we care about whether or not we outlast our money. We have two variables to consider:
The chance that a retiree's portfolio will run out at a given point in time.
The chance of the retiree(s) being alive at this point.
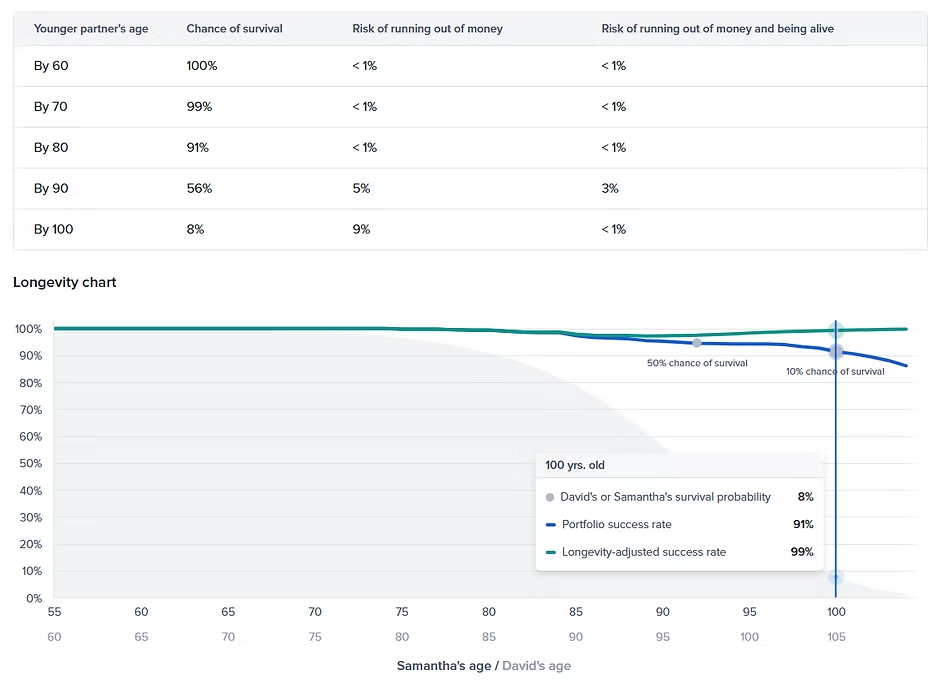
If we look at the 45-year horizon we used in Challenge Six, the diagram below shows that:
1. The chance of David or Samantha being alive when Samantha is 100 is 8%.
2. The chance of the portfolio making it this far is 91%.
The chance of David and Samantha being alive at this age and the portfolio running out is, therefore, less than 1%. (8% chance of one of them being alive multiplied by 9% portfolio failure rate = 0.72%)
Challenge Eight: Not adjusting spending throughout retirement as remaining life expectancy changes
As described above, at the outset, David and Samantha would need to adjust their SWR from 3.35% to 2.90% to extend their retirement horizon from 30 to 45 years. But that is evaluated at the beginning of their retirement. How would things look if they were 15 years older (David would now be 75 and Samantha 70) and both still in good health? Assuming that inflation and market returns had been reasonable, could they not consider increasing their spending faster than the prevailing inflation rate? Our original 30-year horizon had an SWR of 3.35%; at Samantha's age of 70, they may want to plan for 30 years remaining (which might make our original 30-year 3.35% SWR more appropriate).
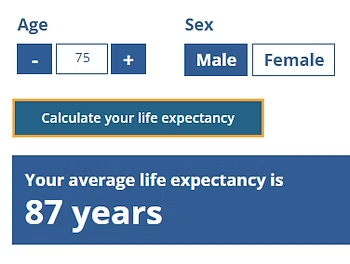
It's worth mentioning that as people age, their life expectancy (which differs from their remaining life expectancy) increases. For example, in the UK, the life expectancy of a 65-year-old male is 85 (20 years remaining life expectancy), according to the ONS.

For a 75-year-old man, this increases by two years to 87 (12 years remaining life expectancy). This is because there was a non-zero chance of them dying between the ages of 65 and 75, and the fact that they didn't means their life expectancy increased (although their remaining life expectancy will, of course, reduce).
Challenge Nine: Spending is assumed to increase with inflation each year
Bengen's logic assumed that David and Samantha increased their spending in line with inflation each year. In the real world, spending doesn't necessarily follow this pattern, often increasing at a rate below inflation. The International Longevity Centre UK (ILC) concluded that "A household headed by someone aged 80 and over spends, on average, 43% (or £131) less than a household headed by a 50-year-old.
If we modify David's and Samantha's spending to increase by 1% less than inflation each year, the starting SWR increases slightly from 3.35% to 3.54%.

Challenge Ten: Does not allow for spending flexibility
Bengen's annual inflation-adjusted withdrawals method does not cater for spending flexibility. For example, say that David and Samantha want to spend an extra £20,000 five years after retirement to take the family (including their three children and partners) on holiday to celebrate Samantha's 60th. This would be tricky to incorporate into the existing methodology. Would they take the £20,000 and spend £5,000 less over the following four years? The rigid logic does not cater for these real-world spending patterns.
Challenge Eleven: Other income sources are not taken into account
One of the assumptions we made for David and Samantha was that they had no other sources of income. The reality is that most people in the UK will receive some form of state pension, with 2023 research suggesting that around half of state pension recipients receive the full amount. With the full state pension now almost £12,000, a couple with full state pensions could see their gross income increase by nearly £24,000 per year when they reach their late 60s. If we add full state pensions for David and Samantha, the SWR has increased by over 1% from 3.35% to 4.51%!
Challenge Twelve: Dying with too much money
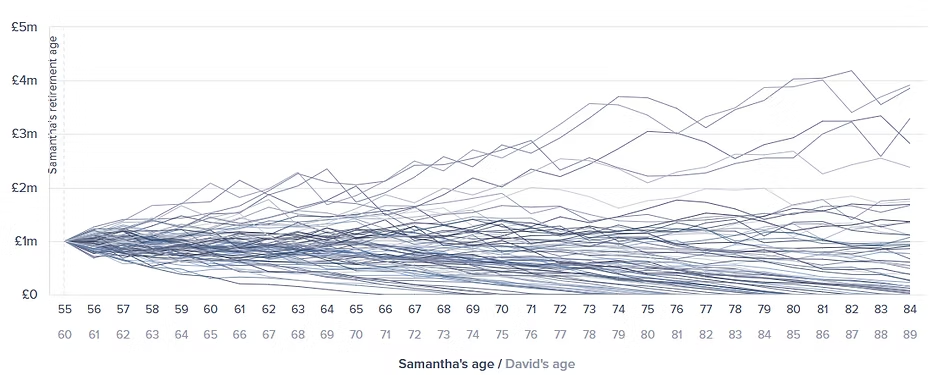
So far, we have only examined worst-case outcomes, which determine the historical SWR. The reality is that historically, there has been a big range of retirement outcomes. Let's revisit Challenge One in the previous article, with an SWR of 3.35%. We can see that if David and Samantha start with a 4% withdrawal (£40,000) and increase withdrawals in line with inflation each year, the average scenario (blue line) has the investment pot being larger in inflation-adjusted terms (around £1.2 million) at the end of the 30 years than when they first retired.

Indeed, in the best-case scenario, the investment pot is over five times larger in real terms after 30 years than at the outset.

Put another way, if David and Samantha had retired in 1981, they would have been able to have a starting withdrawal of 11.1% (£111,200), which is over three times (3.35%) higher than if they had retired in 1915. Of course, they were only able to determine this in hindsight!

It's worth noting that the median outcome allows us to withdraw an inflation-adjusted 6% with the money lasting the entire 30 years.

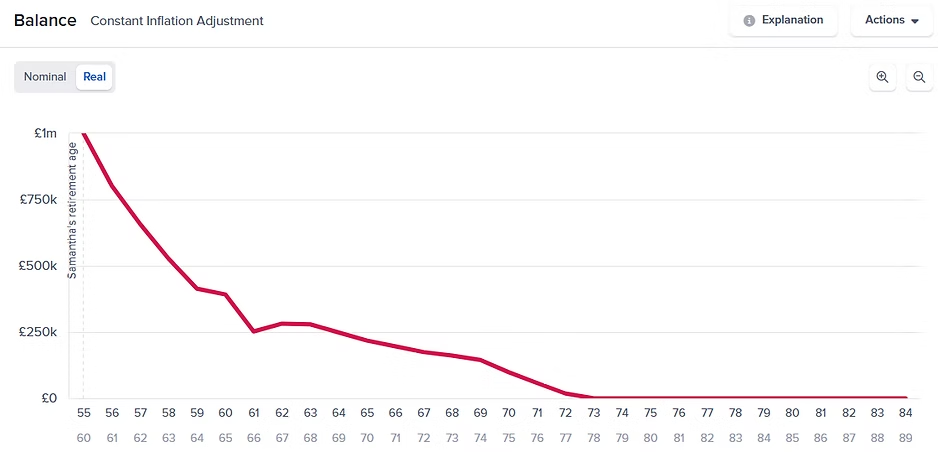
Using a fixed withdrawal rate can have you dying with too much money, which some might feel is almost as bad as running out of money. The Timeline extract below shows the balances for every one of David and Samantha's retirement years when withdrawing an inflation-adjusted £40,000 per annum.
Our challenge is that we don't know exactly what outcome we can expect. David and Samantha may get lucky, or they may not. Luck, in this case, tends to mean a good first decade. This is frustrating for us retirement planners; as you can see from Challenge Nine, spending tends to be highest in early retirement, and we want to encourage our clients to spend their money while they (hopefully) have good health. Unfortunately, at this point, we don't yet know how the first decade will pan out in terms of portfolio returns and inflation and whether we may have a favourable tailwind or a painful headwind!
Challenge Thirteen: Not adjusting spending depending on how "lucky" your retirement outcome is
Following on from Challenge Twelve, the fixed annual inflation-adjusted withdrawal approach does not allow for flexibility of retirement spending if our early retirement years turn out to be reasonably favourable (or at least not disastrous). For example, if we take our best case (1981 retirement shown in green), after the first (pivotal) decade, David and Samantha's portfolio balance has more than doubled in real terms. Given this favourable tailwind, they may feel justified in increasing their spending by more than the prescribed inflation rate. Bengen's rigid logic does not allow for this.

Investor challenges
Challenge Fourteen: Assumes perfect investor behaviour
We talked about the impact of costs on portfolio sustainability. Now, we need to discuss the effects of investor (mis)behaviour on retirement outcomes and investigate investor vs. investment returns. Investment returns are the returns a given portfolio generates, while investor returns are those that the investor actually receives. The difference between investor and investment returns is sometimes known as the 'Behaviour Gap', and as you will see below, measuring this 'gap' can be tricky, and there is no agreement on what it might be.
The Behaviour Gap is caused by investor 'misbehaviour', with common misbehaviours including:
Performance chasing by investing with 'star' fund managers who have enjoyed strong recent returns.
Many stories demonstrate the impact of investor misbehaviour. The problem is that often, it's hard to determine whether they are true! One such story is the infamous Fidelity investment survey, where Fidelity conducted an internal review of customer performance from 2003 to 2013 and determined that those with the best returns were "either dead or inactive." The problem is that no one has been able to verify that story!
Another story features legendary fund manager Peter Lynch and the supposed returns for those invested in his Magellan fund. From 1977 to 1990, Lynch returned a compound annual return of 29%, whereas the average investor in the fund made only 7%. Again, it seems hard to determine where this story came from!
That said, there is evidence to suggest that investors do underperform their investments.
A study of UK investors from 1992 to 2009 finds the behaviour gap to be 1.2% per annum.
A study of US investors from 1991 to 2004 reveals a gap of 1.62% per annum.
Research from Morningstar suggests that the behaviour gap tends to grow as diversification reduces, with multi-asset investors ('Allocation' in the screenshot below) having a gap of 0.4% per annum versus holders of more concentrated sector equity funds, who have a gap of 2.6% per annum. However, recent research questions the Morningstar methodology, finding the behaviour gap to be almost zero.

A study by Ilia Dichev found that investors in the NASDAQ index trailed the benchmark by 5.3% a year from 1973 to 2002.
2022 research from the Investment Company Institute suggests that investors tend to buy high and sell low.

Elderly investors often face a decline in financial literacy. A report titled "Do Older Investors Make Better Investment Decisions?" determined the following.
"Examining the economic costs of aging, we find that, on average, investors with stronger aging effects earn about 3% lower risk-adjusted annual returns, and the performance differential is over 5% among older investors with large portfolios."
Recall from Challenge five that for every 1% increase in total fees, the SWR reduces by around 0.4%, and you see that a misbehaving investor may be surprised at how unsustainable their retirement spending is!
Challenge Fifteen: Being able to cope with drawdowns
Bengen’s logic assumes investors continue withdrawing money even as their portfolio balance drops in challenging markets. A nervous retiree is unlikely to allow this to happen. But what happens if your pot is depleted in the early years of retirement, yet things would have worked out fine in hindsight? For example, our 1920 retiree would see their portfolio balance reduce by almost 25% two years into retirement. Would they be confident to continue their retirement spending, even though history shows they would not have run out?

Positives
So far, we have only examined the potential challenges a retiree may encounter when using Bengen's logic. However, this approach has many positives.
It's easy to implement
This can only be a good thing, especially since our financial literacy tends to decline with age, as mentioned above.

Bengen's approach doesn't require expensive and sophisticated modelling tools that can have a steep learning curve and may not always be intuitive to use, with many nuances that can catch the infrequent user.
Future income is known.
Assuming a retiree's planning assumptions around longevity, market returns, and inflation are prudent, and they are fortunate enough not to experience investment and inflation in retirement (especially in the early years) that are worse than in historical datasets, they can be reasonably confident that they can withdraw an inflation-adjusted amount from their portfolio each year without worrying about running out of money. They don't need to adjust spending based on the market's performance.
Does not require complicated ongoing monitoring
Other than checking the prevailing inflation rate on an annual basis, we do not need to worry about issues such as:
Adjusting our withdrawals based on estimated longevity.
Monitoring our withdrawal rates against various 'guardrails' (necessary for both withdrawal-rate guardrails and risk-based guardrails).
Conclusion
In this article, we have reviewed Bill Bengen's seminal work, which evaluated taking inflation-adjusted withdrawals from a portfolio over fixed timeframes. Bengen's work was instrumental in putting a framework around retirement withdrawal planning. Examples of common thinking at the time included:
The average annual portfolio return is approximately 7%. Therefore, I can withdraw 6-7% a year without fear of running out of money.
In retirement, you cannot afford to take the risk of being invested in the stock market and should instead be invested 100% in bonds.
While Bengen's work was considered groundbreaking at the time, given that retirement research has evolved since his initial publication, there is an argument that it should now be viewed more as an academic exercise rather than a practical tool for real-world retirement planning, one that looks good in theory but less so in practice.
In our next blog, we will examine Guyton-Klinger withdrawal rate guardrails, which aim to address the numerous challenges associated with Bengen's approach. The question is, does this method succeed, or does it introduce new problems......
About Pyrford Financial Planning
Pyrford Financial Planning is an Independent Financial Adviser based in Weybridge, Surrey.
We specialise in retirement planning and provide independent financial advice, including pension and investment advice, and inheritance tax planning.
We offer a no-obligation introductory meeting, which will be held over Zoom.
Our office telephone number is 01932 645150.
Our address is No. 5 The Heights, Weybridge, Surrey, KT13 0NY.
Please note: This blog is for general information only and does not constitute advice. The information is aimed at retail clients only.
Although best efforts are made to ensure all information is accurate, you should not rely on this blog for your personal situation or planning.
The value of your investment can go down as well as up, and you may not get back the full amount you invested. Past performance is not a reliable indicator of future performance.
About the author

Noel is passionate about helping clients plan for retirement, preparing and guiding them through this key life transition. He has written a book on retirement planning and regularly publishes retirement research on this blog.


Comments