
Using risk based guardrails for retirement planning
- Noel Watson CFPᵀᴹ - Chartered Wealth Manager

- Jun 26, 2025
- 9 min read
Updated: Jul 8
Introduction
In previous articles, we reviewed and analysed Bengen's inflation-adjusted withdrawals and Guyton-Klinger's withdrawal-rate guardrail strategies. We discussed how both strategies come with many challenges that a UK retiree needs to be aware of. If you haven't read these yet, we recommend starting with "The 4% rule - is it still valid for UK retirees?"
This article introduces risk-based guardrails and examines their application in retirement planning. Risk-based guardrails take into account many variables to determine sustainable withdrawal rates, including:
Current longevity assumptions.
Expected future income.
Planned changes in retirement income.
This approach provides clients with a more accurate, real-world picture of how much a retiree can sustainably spend than the previous methodologies we have analysed. It's also fair to say that it's a more complex strategy, but with technological developments, there are tools to help manage this. One such tool is Timeline, which we have used in the articles mentioned above (and with our retirement-planning clients!).
It's worth noting that Timeline is (officially) only available to financial advisers. Therefore, those planning their retirement on a DIY basis may need to look elsewhere for a similar tool if they cannot access it.
David and Samantha
To demonstrate the risk-based guardrails approach, let's reintroduce David and Samantha.
David Smith is 60 and has recently retired from ABC Chemicals. His wife, Samantha, is 55 and is also retired. Together, they have a £1,000,000 retirement portfolio and are seeking a sustainable income of £40,000 per annum. For this post, we assume David and Samantha are choosing to work with a financial adviser specialising in retirement planning.
In previous posts, we made several assumptions:
Neither David nor Samantha will receive a state pension.
Taxation and taxation optimisations are ignored.
They do not plan to gift to their children or leave a legacy.
They are not expecting any inheritances.
They do not want to plan for potential care home fees.
They are not planning to downsize.
They are keeping expenditure assumptions simple. For example, they have chosen not to differentiate between early and late retirement spending.
They do not plan to purchase a secure income (e.g., an annuity) at any stage.
They have a 30-year retirement horizon (i.e. David dies at 90 and Samantha at 85).
They are paying no fees.
Iteration One
For the following examples, we will use a portfolio with an asset allocation detailed below.
small-cap
36% developed markets shares (broad)
12% developed markets small-cap value shares
12% emerging market shares (with tilts to small cap value)
20% medium duration global bonds
20% short-duration global bonds
David and Samantha have provided the following information:
They will both receive full state pensions (almost £12,000 each) (assumption 1)
They expect their expenditure to reduce by 1% in real terms (assumption 7). A screenshot from Timeline below shows how this is configured.

Total fees are assumed to be 1% per annum, which covers adviser, platform and investment fees. Typically, the total costs would be for a client of Pyrford Financial Planning (assumption 10) that had £1m invested with us.
We will assume an initial plan length of 45 years, at which point either David or Samantha has a survival probability of 10% or less (assumption 9).
How do things look? In the worst case, we can see that the portfolio is worth more in real terms (circa £1.5m) after 45 years than at the start (£1m).

We can also see their spending decline from the initial £3,300 per month to £2,200 per month (in real terms) in forty-five years. The Smiths are happy with this predictable and gradual reduction in spending.

Iteration Two
David and Samantha's children have encouraged their parents to spend their money and enjoy retirement, so gifting (assumption three) won't be considered for this iteration.
David and Samantha decided on the following amendments:
They would like to up their starting retirement spending to £55,000, sticking with the same 1% per annum reduction in real spending.
They would like to make a provision for later-life care. This will be an additional £50,000 per annum from David's age 98-100 (assumption five).
They would like to include a £30,000 round-the-world trip, to be taken immediately!

How does the plan look now?
We can see two bumps in spending: a smaller one at the start of the plan (a big holiday) and a larger one at the end (later-life care).

In the worst case, the money runs out after around 24 years (we will return to this).

However, if we look at the chance of them being alive when the portfolio runs out, the odds are still very good (see challenge seven for more information)

David and Samantha decide to go with this approach. Let's now look at how things may pan out, with both a good and a bad scenario.
David and Samantha in 10 years - good scenario
We have previously mentioned how important the first decade is to retirement success (see challenge twelve) and how this can be frustrating for retirement planners and retirees. Ideally, we would know the market returns of the first decade so retirees could maximise their spending while they still have their health, but in the absence of time travel, this is just not possible! David and Samantha are fortunate that, given their planned expenditure and current investment balance, they are off to a good start. But what happens after the end of the first decade?
To model this, I will cheat and set their retirement age to 35 rather than 45!

In this scenario, inflation has been relatively benign, and they are now spending £70,000 a year, an increase of £15,000 over their starting withdrawal. Planned care fees are now at £75,000. Note that the big holiday is now in the dim and distant past.

David's state pension is now in payment (£15,000 pa), and Samantha's is due in three years. The markets have been buoyant, and their investment balance is now £1.8m. David and Samantha are still in good health. The worst-case outcome (in contrast to iteration two) is a positive balance after the remaining 35 years.

David and Samantha would like to do two things:
Have another round-the-world trip (now £50,000).
Gift the children (£750,000).
This reduces their balance to £1m.
Looking at the worst-case outcome, this is eminently realistic, and they decide to go ahead.

They have had the good fortune to have a great first decade, and with the underpin of their two state pensions, their retirement continues to look robust.
David and Samantha in 10 years - bad scenario
In contrast, David and Samantha's doppelgangers haven't been quite so fortunate. Their investment balance has remained broadly unchanged, currently sitting at £900,000. All other variables remain as in the previous example. Things are not looking good; at worst, the money will run out within the next fifteen years.

They make the decision to reduce their spending by £7,500 to £62,500. This has the effect of pushing back the worst-case outcome by around a decade.

Note that the two scenarios above are simplifications to highlight the key points. In the real world, the retirement plan and withdrawal strategy are visited much more frequently typically annually) and adjustments (e.g. increased spending, spending cuts, gifting, etc.) tend to happen more regularly.
It's also worth noting that both scenarios are within the expected range of outcomes of David and Samantha's retirement ten years prior, with the best historical balance after ten years being £2.3m (shown below) and the worst £710k.

If we now revisit our assumptions
Neither David nor Samantha will receive a state pension.
Taxation and taxation optimisations are ignored.
They do not plan to gift to their children or leave a legacy.
They are not expecting any inheritances.
They do not want to plan for potential care home fees.
They are not planning to downsize.
They are keeping expenditure assumptions simple. For example, they have chosen not to differentiate between early and late retirement spending.
They are not planning on purchasing a secure income (e.g., annuity) at any stage.
They have a 30-year retirement horizon (i.e. David dies at 90 and Samantha at 85).
They are paying no fees.
We've included the state pension (assumption one) in our Timeline planning, and it's easy to include other sources of income (assumption eight)
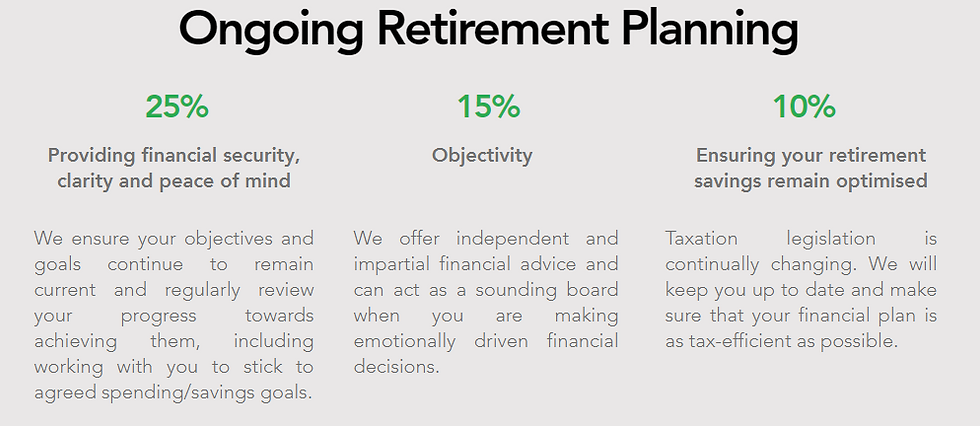
Regarding taxation and tax optimisations (assumption two), this will (or should) be part of the initial and ongoing financial planning service that David and Samantha are paying their adviser for. Note that for simplicity, we have ignored taxation in these examples, but at Pyrford Financial Planning, we optimise lifetime taxation using a cashflow tool called Voyant, and then use gross spending (including tax) in Timeline. Below is an excerpt from our website that highlights some features of our ongoing retirement planning service.
We've looked at gifting (assumption three). Regarding inheritance (assumption four), for prudence, at Pyrford Financial Planning, we tend not to include it in the master plan (as it might well get swallowed up by care fees) but build a 'what-if' scenario, and if the money were to come into the plan, agree where it would go (e.g. gift to the children, increase holiday spending).
An allowance for care home fees has been included in the plan (assumption five). Similar to inheritance, we don't incorporate downsizing (assumption six) into the master plan as there is no guarantee it will happen, but again, this often forms part of a 'what if' plan in Voyant.
For our example, we assumed a 1% reduction in real income (assumption seven), and both Timeline and Voyant allow the flexibility to accommodate more complex "shapes" of planned expenditure and evaluate outcomes.
Timeline caters for longevity expectations (assumption nine) and evaluates the likelihood of clients outlasting their money.
The timeline allows the incorporation of fees (assumption ten) into the plan, and all our modelling includes these fees.
That's the assumptions covered; what about the challenges?
Challenge One: US data – 4% “rule” doesn’t necessarily hold for the UK.
Challenge Two: Asset allocation of 50% stocks and 50% bonds.
Challenge Three: Limited historical data.
Challenge Four: Starting stock market valuations are not taken into account.
Challenge Five: Zero fees.
Challenge Six: 30-year retirement horizon.
Challenge Seven: Not evaluating whether the money is likely to outlast the retiree.
Challenge Eight: Not adjusting spending throughout retirement as remaining life expectancy changes.
Challenge Nine: Spending is assumed to increase with inflation each year.
Challenge Ten: Does not allow for spending flexibility
Challenge Eleven: Other income sources are not taken into account.
Challenge Twelve: Dying with too much money.
Challenge Thirteen: Not adjusting spending depending on how "lucky" your retirement outcome is.
Challenge Fourteen: Assumes perfect investor behaviour.
Challenge Fifteen: Being able to cope with drawdowns.
For Challenges one and two, Timeline's historical asset class data is very similar to the assets we use to build portfolios, giving clients confidence that our modelling is robust.
For Challenge three, as with the previous modelling, we will always be constrained by limited historical data. As professional advisers, we err on the side of caution with our modelling, with clients running out of money by far the worst outcome.
Regarding challenge four, while we can't fully avoid bubbles, diversification (across asset classes, countries, etc.) helps to minimise the impact of highly valued markets producing poor future returns.
Fees are easily incorporated into Timeline, which addresses challenge five.
For challenges six through eleven and thirteen, we've seen how Timeline provides spending flexibility and allows us to evaluate the impact of these proposed changes.
Challenge twelve is an interesting one. As mentioned above, we like to be prudent in our assumptions, and the worst-case scenario for our clients is running out of money. That said, if Timeline indicates the client is overly conservative in their spending plans, we will seek to reassure them that they can increase spending/gifting.
Challenges fourteen and fifteen are where the financial adviser (should) earn their fees. At Pyrford Financial Planning, we undertake regular "lifeboat drills" with our clients, in which we evaluate periods of market volatility (e.g., the 2000 dot com bust) and ensure the client is comfortable enough to cope with these inevitable periodic drawdowns. Of course, drills are no substitute for being immersed in icy water, but we feel this approach gives our clients the best chance of "sticking with the plan". We educate our clients on investing topics, including what has worked historically and, perhaps more importantly, how fads and investing in "what is working now" can be detrimental to your wealth.
Conclusion
We feel that the risk-based guardrails approach is much better aligned with real-world retirement planning than the Bengen or withdrawal-rate guardrails approach (Guyton is one example). While a guardrails-based approach may require some cuts in (real) expenditure if the retiree experiences a poor series of market returns, the risk-based method should mean that the cuts are far less severe. This screenshot, taken from an Income Lab video (a U.S. based software company similar to Timeline) demonstrates this for the period after the Great Depression.

Of course, as we mentioned at the start, the risk-based approach is complex and probably requires a specialist financial adviser to help you navigate it, so it may not be suitable for those implementing their retirement on a DIY basis.
Want to find out more?
If you want help building a robust retirement plan that incorporates a risk-based guardrails approach, please get in touch.
About Us
The team at Pyrford Financial Planning are highly qualified Independent Financial Advisers based in Weybridge, Surrey. We specialise in retirement planning and provide financial advice on pensions, investments, and inheritance tax.
Our office telephone number is 01932 645150.
Our office address is No 5, The Heights, Weybridge KT13 0NY.
Please note: This blog is for general information only and does not constitute advice. The information is aimed at retail clients only.


Comments